This post is just answering two simple questions:
1. Can Quest Software's Spotlight successfully monitor SQL Server Analysis Server?
2. If it can, what SSAS parameters, databases' and cubes' details it monitors and provides information about?
To answer these question I'd have to download, install and configure Spotlight software.
I've downloaded the trial version from official Quest Software web site:
https://www.quest.com/products/spotlight-on-sql-server-enterprise/
So, the answer for the first question is "Yes".
The newest 13.3 version of the application monitors not only Windows box and SQL Server, but Analysis Services as well!
After fully configured on my local machine it looks like this
I've configured it to monitor my local SQL Server, Windows box and Analysis Services Server.
I'm not really interested in Windows or SQL Server and click to see "Analysis Services"
It is common Quest Software design and I do not have to learn on how to use it.
The screen provides following metric categories:
- Connections
- Memory
- Storage
- CPU
- Server
When I click on some metrics it opens a menu, to see the details
For instance when I click on connections I get following drop down menu:
When I click on "Eye" sign I can see the list of current connections with all their parameters:
From there I can easily switch tab to current "Sessions"
Or just to list of most recent commands. If I select a command I can see the most recent query for a connection:
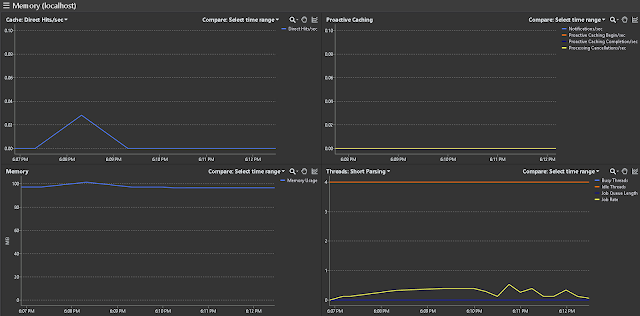
Memory section allows me to see general memory usage, caching metrics and threads' stats:
Storage section provides me information about my SSAS databases.
In this case I have only one AdventureWorks DB:
And from that screen I can easily switch to "Cubes"
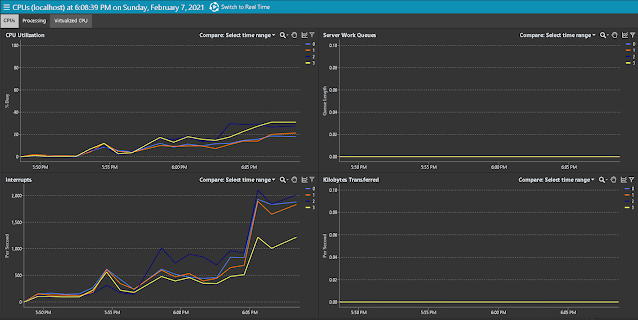
CPU information is reporting only general box metrics of the processor like CPU Utilization, number of "Interrupts", "Kilobytes Transferred" and "Server Work Queues":
When I switched to "Processing" tab I could see other box metrics, such as Queue Length, Threads and Processes count, and Context Switching:
The "Server" section is least informative. It provides me only my server version and edition and status of Disk and Memory:
Besides of all these semi-static data there are supposed to be provided immediate data from my SSAS:
- Queries Answered/s
- Queries Requested/s
- Queries From Cache Direct/s
- Queries From File/s
- Temp File Rows Written/s
- Rows Read/s
- Rows Written/s
- Direct Hit Ratio
- Current Latch waits
- Current Lock waits
- Query Pool Job Queue Length
- Etc.
Unfortunately I have only one databases and couldn't generate a significant activity to rise those numbers above zero level.
Hope my info helped you to answer similar questions as mine.
And stay tuned, I plan to hit other SSAS monitoring tools and go beyond of it.


