Showing posts with label BI. Show all posts

Friday, February 7, 2025

SSIS: REPLACENULL does not support (DT_DBTIMESTAMP2,7)

 Using the "REPLACENULL" functionality frequently in the "Derived Column" component, the "Conditional Split" component, and other places in SSIS where formulas can be applied is common.

However, I recently encountered an issue with the "DT_DBTIMESTAMP2" data type.

The following formula produced an error:

REPLACENULL(TestDt, (DT_DBTIMESTAMP2,7)"1900-01-01 00:00:00.0000000")

Error: 0xC020902A at Test Transformation, Derived Column [2]: The "Derived Column" failed because truncation occurred, and the truncation row disposition on "Derived Column.Outputs[Derived Column Output].Columns[TestDt]" specifies failure on truncation. A truncation error occurred on the specified object of the specified component.

This error occurs because "REPLACENULL" returns a "DT_WSTR" data type. To make it work, we need to convert "DT_DBTIMESTAMP2" to "DT_WSTR" and then convert it back to "DT_DBTIMESTAMP2", like this:

(DT_DBTIMESTAMP2,7)REPLACENULL((DT_WSTR,30)TestDt,"1900-01-01 00:00:00")


Alternatively, a more elegant solution is to replace "REPLACENULL" with an "IF" condition:

ISNULL(TestDt)?(DT_DBTIMESTAMP2,7)"1900-01-01 00:00:00":TestDt


Thursday, January 30, 2025

SSIS warning message about SSAS Cube processing: "Operation completed with XXX problems logged"

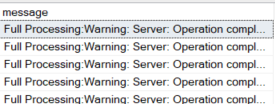
If you process SSAS cubes via SSIS packages you might notice a weird message like "Full Processing:Warning: Server: Operation completed with XXX problems logged."

How you can get that message (if you have that problem):

1. You can do a report, from your package's execution and get something like this:

SSIS processing SSAS Cube Warning message


2. You can run a T-SQL script against your SSIS server:

SELECT TOP 100 message_time, message
FROM [SSISDB].[internal].[operation_messages]
WHERE message_type = 110 AND message_source_type = 40
   AND message LIKE '%Warning: Server: Operation completed with%problems logged.'
ORDER BY message_time DESC;

If you have that problem you might have something like this:


The Problem.

1. SSIS Server does not provide you any details on that warning nor any associated problem.
2. SSAS Server also does not report any problems associated with that Cube processing.

Solution.

You can use "Extended Events" to capture these problems:

1. For that, you have to create an Extended Event Session using following script on your SSAS Server

<Create xmlns="http://schemas.microsoft.com/analysisservices/2003/engine">
  <ObjectDefinition>
    <Trace>
      <ID>SSAS_CubeProcessing_Stream</ID>
      <Name>SSAS_CubeProcessing_Stream</Name>
      <XEvent xmlns="http://schemas.microsoft.com/analysisservices/2011/engine/300/300">
        <event_session name="SSAS_CubeProcessing_Stream" dispatchLatency="0" maxEventSize="0" maxMemory="4096" memoryPartition="none" eventRetentionMode="AllowSingleEventLoss" trackCausality="true" xmlns="http://schemas.microsoft.com/analysisservices/2003/engine">
          <event package="AS" name="ProgressReportError" />
          <target package="package0" name="event_stream" />
        </event_session>
      </XEvent>
    </Trace>
  </ObjectDefinition>
</Create>

2. Then you run "Watch Live Data" for that session

3. Run your SSIS Cube processing package and monitor the events.

As the result you'll get something like this:


A Problem description you can find in an Event's details under "TextData" name:


At the end, do not forget to delete your Extended Events monitoring Session.

Monday, May 13, 2024

Caveats of using an Expression for SQL Script in SSRS.

Why: Most of the time, when you want a flexibility of your SQL query you can use parameterization. However there might be a situation when you'd need to build a dynamic query. In my case I used SQL query within an expression to feed it to multiple data sources targeting different servers with the exact same query.

DataSet creation: Creation of a simple dataset.

I've created a sample dataset with a sample query:

-- That is a sample query
select top 10 * 
from sys.messages


After we created the dataset we can create a Tablix in our report and test it:


Creation of an Expression

1. Create a new parameter called "SQLExpression"


2. Go to the "Default Values" tab select "Specify values" and choose "fx" box

3. Specify Expression value:

Assign Expression to the DataSet: Return to the Sample DataSet and Specify newly created parameter as the source for DataSet Expression.

Within the expression replace the query by the parameter:
Save changes and try your report.
If  you've done exactly like I did you get an empty report.

Troubleshooting: If you specified your parameter as "Visible" you might notice that report processor aggregated all 3 rows of our query into the one, making it a single comment


Other cases: My case was very easy, but in the most of the cases you'll usually get a weird error message for your query, while the query itself runs fine in SSMS.

Lessons Learned: When we use SQL Query Expressions we have to follow these rules:
1. Use only DOUBLE comment or do not use comments at all.
2. Put at least one space or a tabulation before the very first symbol on each line.
3. Use semicolon symbol to separate multiple SQL instructions.
4. Do not use "GO" command.

The Fix: Change the default value for "SQLExpression" parameter to following query: 

/* That is the Fixed SQL Query
 refurbished for SSRS expression usage*/

 DECLARE @MessageID INT = 101;
 SELECT *
 FROM sys.messages
 WHERE message_id = @MessageID;

Save the parameter and re-run the report.

Enjoy the result of your SQL Query Expression:

Conclusion: Use of SQL Expressions is very easy if you fallow those 4 rules. 

Please let me know if you hit any other situation in question and I'll add it for others to avoid.


Monday, July 27, 2020

SSRS. Use of Lookup type functions.

There is a lot of blog posts in the Internet about how to use Lookup and other functions of this type in SSRS.
It is very straight forward and easy to use.
However, I've managed to make a mistake and I assume have the same problem if you got to that page.

The Error

At firs, here is the error I've got when I tried to use Lookup function in SSRS:
The expression used for the calculated field 'ProductName' includes an aggregate, RowNumber, RunningValue, Previous or lookup function. Aggregate, RowNumber, RunningValue, Previous and lookup functions cannot be used in calculated field expressions.

How did I get there?

At first, I've created two data sets "WorkOrders" and "Products"

Then I wanted to include "Product Name" into my "Work Order Report"
Here is How I've done it:

The WRONG WAY

(that is how it shouldn't been done)
Obviously, if I use a function I thought I have to use it in a calculated field

But That is Wrong

You should do it the right way:

The RIGHT WAY

That is not obvious, but you have to use "Query Field" to use the Lookup function:

Then you just have to specify New Field's name and insert a formula.
In my case I used following:

=Lookup(Fields!ProductID.Value, Fields!ProductID.Value, Fields!Name.Value, "Products")


That worked very well for me and I hope you will struggle less by reading this.
Good Luck


Wednesday, October 30, 2019

Power BI Desktop: How to determine a Connectivity mode for a query? Can I change it?

After you build Power BI dashboard you want to make sure that everything is set as it supposed to be.

Or, you are troubleshooting PBI dashboard performance and trying to figure out what it is doing.

For a Power BI dashboard it is very important if it runs against live data or internally imported data.
Which Connectivity/Storage mode your query is using, "DirectQuery" or "Import"?

That is very easy to determine, just put your cursor above name of your data set, and after about one second an informational label will tell you a Storage mode for that query.
Looks like this:


As you can in my dashboard: data set "Objects" is "Imported", but data set "Partitions" has "DirectQuery" as a source.

Now will take a look on how to change it.
So far I haven't found a menu option for doing this, but it is still possible:

1. First, start "Query editor". Then:
- Highlight your query (Partitions);
- Choose "Transform" tab in a menu;
- Click on "Group By" menu item.

2. You do not have to do anything in the "Group By" interface. Just hit "OK".

3.Than "Switch all tables to Import mode" button should appear at the top of your data:

4. Remember that is the ONE WAY ROAD, you won't be able to get back if you press this button. If you just will try to apply the changes without switching you'll get an error message like this:

5. Whether you decided to switch from "DirectQuery" to "Import" Storage mode you have to clean your "Grouping By" change by deleting it. Just simply click on a cross on the left side of the pane of your query:

 At the end, I want to point again:
You can easily switch from "DirectQuery" to "Import" Storage mode, but you can't go back.
So, be careful with it.

Wednesday, October 23, 2019

Integer Number limitation in Power BI

By doing heavy calculations with big integer numbers I've hit Power BI whole number limit, which is "9,007,199,254,740,992".

If you try to get to any number higher than that Power BI will start rounding your results.

Here is what I've found about that problem online:
Source: Data types in Power BI Desktop

I've done my own research and here is what I've found.
Here are two queries I've created for the test:
SELECT TOP 62 [Power]=ROW_NUMBER() OVER(ORDER BY (SELECT NULL))
       ,[Number]=POWER(CAST(2 AS BIGINT),ROW_NUMBER() OVER(ORDER BY (SELECT NULL)))
       ,[Number+1]=POWER(CAST(2 AS BIGINT),ROW_NUMBER() OVER(ORDER BY (SELECT NULL)))+1
       ,[Number-1]=POWER(CAST(2 AS BIGINT),ROW_NUMBER() OVER(ORDER BY (SELECT NULL)))-1
FROM sys.messages;
GO
SELECT TOP 62 [Power]=ROW_NUMBER() OVER( ORDER BY ( SELECT NULL))
       ,[Number]=-POWER(CAST(2 AS BIGINT),ROW_NUMBER() OVER(ORDER BY (SELECT NULL)))
       ,[Number+1]=1-POWER(CAST(2 AS BIGINT),ROW_NUMBER() OVER(ORDER BY (SELECT NULL)))
       ,[Number-1]=-1-POWER(CAST(2 AS BIGINT),ROW_NUMBER() OVER(ORDER BY (SELECT NULL)))
FROM sys.messages;

GO
First query produces positive powers of "2" and second produces negatives.
The result in SSMS looks like this:

I've used both queries in Power BI Desktop and here is what I've got:

The result was expected, all numbers bigger than "9,007,199,254,740,992" and less than "-9,007,199,254,740,992" were rounded, but I've got something totally unexpected.

Look at the highlighted red boxes. The SUM of positive numbers produces negative Total and the SUM of negative numbers produces positive Total!

That might be a "feature", but it looks like a bug for me.

That behavior persists in the newest release: Version: 2.74.5619.841 64-bit (October, 2019)

Tuesday, October 22, 2019

Link tables in Power BI by two columns

Power BI is not always friendly to BI developer and you need to do some work around to get what you need.
Here is a simple case:

The Problem:

We have two tables in Power BI Desktop, which we need to link, but it happens they have to be linked by two columns.

The Case:

Simplest case is to create two Queries to a "master" table in any SQL Server. Call them "Partitions" and "Indexes":
 

Here are these simplest queries:

-- Partitions
SELECT * FROM sys.dm_db_partition_stats;
-- Indexes

SELECT * FROM sys.indexes;

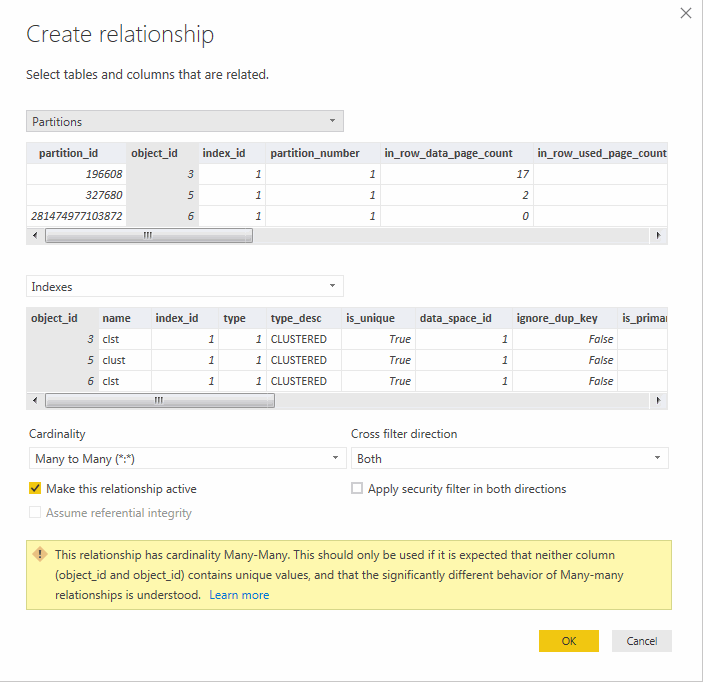
If we go now to a model tab and try to link tables by "object_id" column . . .

We will get a message that we can build only "Many-2-Many" relationship and if we want to do a "One-2-Many" we need to have a column to be unique on one side:

The problem is that we can't select two columns to link those two tables to establish relationship.

The Solution:

Do a right click on "Indexes" query in the "Fields" tab and select "New Column":
 Specify following formula in the "New Column" box at the upper left:
Index_Key = POWER (2,32) * Indexes[index_id] + Indexes[object_id]

Like this:

Create new column in the "Partitions" the same way as for "Indexes":

The formula for Partitions will be only slightly different:
Index_Key = POWER (2,32) * Partitions[index_id] + Partitions[object_id]

Will look like this:

As the result, you will see the New columns in the modeling view, where you can click on "Manage Relationship" button in the menu.

For the new relationship specify following:
1. First table: "Indexes"
2. Second table: "Partitions"
3. Select the very last column "Index_Key" in both tables
4. Specify cardinality as "One to many (1:*)"
5. Apply security filter in both directions (optional)
6. Hit OK

Now you are supposed to get such a beautiful "One-2-Many" relationship:

Possible caveats:

In my example "Index_id" numbers are very small.
If your calculated number hits a value bigger than "POWER (2,53)", which is the current Power BI Desktop application limit for the Whole numbers, in numeric form the limitation number is: "9007199254740992"
*That is applicable for version of: 2.73.5586.661 64-bit (September, 2019)

In that kind of situation you can use a string concatenation formulas like this:
Index_Key = Indexes[object_id] & "-" & Indexes[index_id]
Index_Key = Partitions[object_id] & "-" & Partitions[index_id]

*The "-" symbol is very important, because you can hit the situations when two numbers can possibly generate a similar string like "1&11" produces "111" and "11&1" also produces "111", which won't allow you to establish the uniqueness.

Thursday, October 10, 2019

Something went wrong with PowerBI report

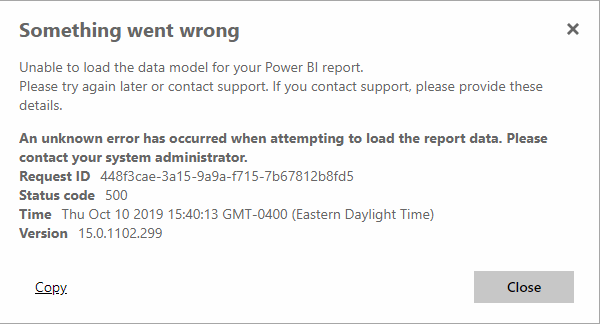
Got a request from a customer earlier today about very strange error:

Something went wrong
Unable to load the data model for your Power BI report.
Please try again later or contact support. If you contact support, please provide these details.
An unknown error has occurred when attempting to load the report data. Please contact your system administrator.:
Request ID: 448f3cae-3a15-9a9a-f715-7b67812b8fd5
Status code: 500
Time: Thu Oct 10 2019 15:40:13 GMT-0400 (Eastern Daylight Time)
Version: 15.0.1102.299


After a little research it has been discovered that errored report does not hit a database at all.
Which led to an idea of wrong credentials.
After credentials were updated customers were able to successfully run the report.

Here are the easy steps:

Step #1. Right click on the report's three dots (...) and choose "Manage" from the list.

Step #2. Select "Data sources" in the report's left panel.

Step #3. Update user credentials.


I haven't had time to investigate the issue, but it looks like after report was deployed and tested, something went wrong and credential record from the newly loaded report stopped matching Server's credential record, which stopped report from running.

The idea is: to use windows authentication or re-establish credentials after every new deployment.


Thursday, August 29, 2019

Powered by Power BI and Power Query - PASS Summit schedule


Just want to introduce a sample Power BI report with some Power Query use.

Description: 

- A single Power BI file "PassSummit_Schedule.pbix" (can be downloaded by click);
- It is a little and very simple Power BI report, which only provides browsing and selecting capabilities over PASS Summit 2019 schedule;
- The report is tied to PASS web site schedule page: https://www.pass.org/summit/2019/Learn/Schedule.aspx;
- The report demonstrates the basic Power Query and Power BI capabilities;
- The report can be viewed and used via Power BI Desktop Application or uploaded to your own Power BI Azure portal.

Functionality:


  1. You can browse through all PASS Summit 2019 sessions sorting and filtering them by day, time, speaker, level, and room;
  2. You can build your own schedule and get printable version of it.
Here is how it looks like:

Internals:

The report references PASS Summit schedule page: https://www.pass.org/summit/2019/Learn/Schedule.aspx as a data source using following Power Query:
let
    Source = Web.Page(Web.Contents("https://www.pass.org/summit/2019/Learn/Schedule.aspx")),
    Data1 = Table.AddColumn(Table.AddIndexColumn(Source{5}[Data], "Index", 0, 1), "PassSummitDay", each "Day 1 - Monday"),
    Data2 = Table.AddColumn(Table.AddIndexColumn(Source{6}[Data], "Index", 0, 1), "PassSummitDay", each "Day 2 - Tuesday"),  
    Data3 = Table.AddColumn(Table.AddIndexColumn(Source{7}[Data], "Index", 0, 1), "PassSummitDay", each "Day 3 - Wednesday"),
    Data4 = Table.AddColumn(Table.AddIndexColumn(Source{8}[Data], "Index", 0, 1), "PassSummitDay", each "Day 4 - Thursday"), 
    Data5 = Table.AddColumn(Table.AddIndexColumn(Source{9}[Data], "Index", 0, 1), "PassSummitDay", each "Day 5 - Friday"),
    Data59 = Table.Combine({Data1,Data2,Data3,Data4,Data5}),
    #"Changed Type" = Table.TransformColumnTypes(Data59,{{"Column1", type text}, {"Column2", type text}, {"Column3", type text}, {"Column4", type text}, {"Column5", type text}, {"Column6", type text}, {"Column7", type text}, {"Column8", type text}, {"Column9", type text}, {"Column10", type text}, {"Column11", type text}, {"Column12", type text}, {"Column13", type text}, {"Column14", type text}, {"Column15", type text}, {"Column16", type text}, {"Column17", type text}, {"Column18", type text}, {"Column19", type text}, {"Column20", type text}}),
    #"Combined columns" = Table.Distinct( Table.Combine({ 
Table.AddColumn(Table.SelectColumns(Table.RenameColumns(#"Changed Type", {{"Column1","Time"},{"Column2","Session"}}),{"PassSummitDay", "Time", "Session", "Index"}), "Index2", each 0),
Table.AddColumn(Table.SelectColumns(Table.RenameColumns(#"Changed Type", {{"Column1","Time"},{"Column3","Session"}}),{"PassSummitDay", "Time", "Session", "Index"}), "Index2", each 1),
Table.AddColumn(Table.SelectColumns(Table.RenameColumns(#"Changed Type", {{"Column1","Time"},{"Column4","Session"}}),{"PassSummitDay", "Time", "Session", "Index"}), "Index2", each 2),
Table.AddColumn(Table.SelectColumns(Table.RenameColumns(#"Changed Type", {{"Column1","Time"},{"Column5","Session"}}),{"PassSummitDay", "Time", "Session", "Index"}), "Index2", each 3),
Table.AddColumn(Table.SelectColumns(Table.RenameColumns(#"Changed Type", {{"Column1","Time"},{"Column6","Session"}}),{"PassSummitDay", "Time", "Session", "Index"}), "Index2", each 4),
Table.AddColumn(Table.SelectColumns(Table.RenameColumns(#"Changed Type", {{"Column1","Time"},{"Column7","Session"}}),{"PassSummitDay", "Time", "Session", "Index"}), "Index2", each 5),
Table.AddColumn(Table.SelectColumns(Table.RenameColumns(#"Changed Type", {{"Column1","Time"},{"Column8","Session"}}),{"PassSummitDay", "Time", "Session", "Index"}), "Index2", each 6),
Table.AddColumn(Table.SelectColumns(Table.RenameColumns(#"Changed Type", {{"Column1","Time"},{"Column9","Session"}}),{"PassSummitDay", "Time", "Session", "Index"}), "Index2", each 7),
Table.AddColumn(Table.SelectColumns(Table.RenameColumns(#"Changed Type", {{"Column1","Time"},{"Column10","Session"}}),{"PassSummitDay", "Time", "Session", "Index"}), "Index2", each 8),
Table.AddColumn(Table.SelectColumns(Table.RenameColumns(#"Changed Type", {{"Column1","Time"},{"Column11","Session"}}),{"PassSummitDay", "Time", "Session", "Index"}), "Index2", each 9),
Table.AddColumn(Table.SelectColumns(Table.RenameColumns(#"Changed Type", {{"Column1","Time"},{"Column12","Session"}}),{"PassSummitDay", "Time", "Session", "Index"}), "Index2", each 10),
Table.AddColumn(Table.SelectColumns(Table.RenameColumns(#"Changed Type", {{"Column1","Time"},{"Column13","Session"}}),{"PassSummitDay", "Time", "Session", "Index"}), "Index2", each 11),
Table.AddColumn(Table.SelectColumns(Table.RenameColumns(#"Changed Type", {{"Column1","Time"},{"Column14","Session"}}),{"PassSummitDay", "Time", "Session", "Index"}), "Index2", each 12),
Table.AddColumn(Table.SelectColumns(Table.RenameColumns(#"Changed Type", {{"Column1","Time"},{"Column15","Session"}}),{"PassSummitDay", "Time", "Session", "Index"}), "Index2", each 13),
Table.AddColumn(Table.SelectColumns(Table.RenameColumns(#"Changed Type", {{"Column1","Time"},{"Column16","Session"}}),{"PassSummitDay", "Time", "Session", "Index"}), "Index2", each 14),
Table.AddColumn(Table.SelectColumns(Table.RenameColumns(#"Changed Type", {{"Column1","Time"},{"Column17","Session"}}),{"PassSummitDay", "Time", "Session", "Index"}), "Index2", each 15),
Table.AddColumn(Table.SelectColumns(Table.RenameColumns(#"Changed Type", {{"Column1","Time"},{"Column18","Session"}}),{"PassSummitDay", "Time", "Session", "Index"}), "Index2", each 16),
Table.AddColumn(Table.SelectColumns(Table.RenameColumns(#"Changed Type", {{"Column1","Time"},{"Column19","Session"}}),{"PassSummitDay", "Time", "Session", "Index"}), "Index2", each 17),
Table.AddColumn(Table.SelectColumns(Table.RenameColumns(#"Changed Type", {{"Column1","Time"},{"Column20","Session"}}),{"PassSummitDay", "Time", "Session", "Index"}), "Index2", each 18)})),
    #"Sorted Rows" = Table.Sort(#"Combined columns",{{"PassSummitDay", Order.Ascending}, {"Index2", Order.Ascending}, {"Index", Order.Ascending}}),
    #"Added Index" = Table.AddIndexColumn(#"Sorted Rows", "Index1", 0, 1),
    #"Filtered Rows1" = Table.SelectRows(#"Added Index", each ([Time] <> "Room")),
    #"Filtered Rows" = Table.SelectRows(#"Added Index", each ([Time] = "Room")),
    #"Filtered Rows2" = Table.AddColumn(#"Filtered Rows", "Index3", each [Index1]+1),
    #"Merged Queries" = Table.NestedJoin(#"Filtered Rows1",{"Index1"},#"Filtered Rows2",{"Index3"},"Filtered Rows1",JoinKind.LeftOuter),
    #"Expanded Filtered Rows1" = Table.ExpandTableColumn(#"Merged Queries", "Filtered Rows1", {"Session"}, {"Room"}),
    #"Grouped Rows" = Table.Group(#"Expanded Filtered Rows1", {"PassSummitDay", "Time", "Room", "Session", "Index"}, {{"Index3", each List.Max([Index2]), type number}}),
    #"Sorted Rows1" = Table.Sort(#"Grouped Rows",{{"PassSummitDay", Order.Ascending}, {"Index", Order.Ascending}, {"Index3", Order.Ascending}}),
    #"Added Index0" = Table.AddIndexColumn(#"Sorted Rows1", "Index0", 0, 1),
    #"Removed Columns" = Table.RemoveColumns(#"Added Index0", {"Index","Index3"}),
    #"Split Column by Delimiter" = Table.SplitColumn(#"Removed Columns", "Session", Splitter.SplitTextByEachDelimiter({"#(cr)#(lf)"}, QuoteStyle.Csv, false), {"Session Topic", "Speaker"}),
    #"Changed Type0" = Table.TransformColumnTypes(#"Split Column by Delimiter",{{"Session Topic", type text}, {"Speaker", type text}}),
    #"Split Column by Delimiter1" = Table.SplitColumn(#"Changed Type0", "Speaker", Splitter.SplitTextByEachDelimiter({"#(cr)#(lf)"}, QuoteStyle.Csv, true), {"Session Speaker", "Session Level"}),
    #"Changed Type1" = Table.TransformColumnTypes(#"Split Column by Delimiter1",{{"Session Speaker", type text}, {"Session Level", type text}}),
    #"Replaced Value1" = Table.ReplaceValue(#"Changed Type1","#(cr)#(lf)","",Replacer.ReplaceText,{"Session Speaker"}),
    #"Replaced Value2" = Table.ReplaceValue(#"Replaced Value1","#(cr)#(lf)","",Replacer.ReplaceText,{"Session Topic"}),
    #"Trimmed Text" = Table.TransformColumns(#"Replaced Value2",{{"Session Speaker", Text.Trim}}),
    #"Replaced Value3" = Table.ReplaceValue(#"Trimmed Text",null,"",Replacer.ReplaceValue,{"Session Topic", "Session Speaker","Session Level", "Room"}),
    #"Filtered Rows3" = Table.SelectRows(#"Replaced Value3", each ([Session Topic] <> "") and not Text.Contains([Time], "* ")),
    #"Added Conditional Column" = Table.AddColumn(#"Filtered Rows3", "Show", each if [Room] = "" then "Breaks" else "Sessions")
in
    #"Added Conditional Column"

Even though query looks quite a large, but it is just a set of single steps. 

For the front end the report uses three pages:

  1. Main Schedule - Use of Sorting & Filtering Power BI features;
  2. Build My Schedule - Here you can select sessions you'd like to attend;
  3. My Schedule - Full report of selected sessions.

Disclaimer:

Unfortunately the report is not looking at the original data source and tided only to the web page. That means that any formatting changes on the schedule page will break the Power BI report, but I hope there will be non changes until the PASS Summit other than filling the gaps for "To Be Announced" items, which should be handled correctly.
In case report breaks, please let me know and I'll fix it.