Wednesday, March 30, 2016

Only Transaction Log Backup can free space in the Transaction Log in Full and Bulk-Logged Recovery Models

This post is about well known fact that only way to claim back space Transaction Log in Full and Bulk-Logged Recovery Models is to do a Transaction Log Backup.

Paul Randall has a wonderful post about that topic: "Misconceptions around the log and log backups: how to convince yourself".
Will quote him: "There’s still a widely held misconception that when properly in the FULL or BULK_LOGGED recovery models that full or differential backups can truncate the log. No. It *NEVER* happens."

His post was published almost SEVEN years ago, but there are still a lot of people who thinks differently. There are thousands of databases where transaction log is hundred times bigger than the data itself.
Millions of petabytes of unnecessary data around the world are sitting uselessly on companies' hard drives bringing revenue to SAN distributors.

Will do it, as always, in steps:

What is the problem?

Will repeat it again and again: If your database in Full or Bulk-Logged Recovery Models, all transactions, recorded to the Log file, won't go away and will sit there forever, until Transaction Log Backup will be performed.

What is wrong with that?

At first, growing log file will eat your disk space. If your database is small and has almost no activity, you can live without even knowing about the problem for couple of years and when your database will stop accepting any new transactions because of Full Disk issue you will be running and screaming trying to figure out how to fix the issue.
At second, Log file will grow in small increments. By default, Log file auto-growth increment is 10%. It will take 100! File growth events until you reach size of 10Gb from it's initial size of 0.75 Mb. That creates huge file fragmentation not only on a drive, but also it creates internal Log File fragmentation.
In your firs 10Gb will be about 800 Virtual Log Files (VLFs). I've seen the case when Database's Log file had 200K VLFs!
At third, in case of disaster you would have to backup whole your Transaction Log, which will take a lot of extra time for the old Gigabytes of log data while your production system is down.

Why that was happened?

Every new database you create is just a copy of Model database. Model database, by default, is in Full Recovery Model.Very few people are changing recovery model to Simple or scheduling a log backup job right after database creation.

How to prevent that?

The easiest thing is to switch Model database on the server to Simple Recovery Model. then all new databases will be in Simple mode.
In a case, when customer requires you to have a database in Full Recovery Model, everybody must understand what does it mean, why that is necessary, and how to use it for your advantage.
You also have to develop the RESTORE strategy, which will include Transaction Log backup and you won't have a problem of growing transaction log at all.

To justify my post will provide a little demo:

Script #1. Create a test database. Switch it to the Full Recovery Model and do an initial Full Database Backup.
use Master;
GO
IF EXISTS (SELECT TOP 1 1 FROM sys.databases WHERE name = 'TestLogBackup')
BEGIN
  ALTER DATABASE TestLogBackup SET RESTRICTED_USER WITH ROLLBACK IMMEDIATE 
  DROP DATABASE TestLogBackup;
END
GO
CREATE DATABASE TestLogBackup;
GO
ALTER DATABASE TestLogBackup SET RECOVERY FULL;
GO
BACKUP DATABASE [TestLogBackup] TO  DISK = N'C:\SS2014\Backup\TestLogBackup_1_Full.bak' 
WITH NOFORMAT, INIT, SKIP, NOREWIND, NOUNLOAD,  STATS = 10
GO

Script #2. Reporting script. We will use it multiple times during the demo:
USE TestLogBackup;
GO
SELECT name AS [Database Name], create_date, recovery_model_desc FROM sys.databases 
WHERE name = 'TestLogBackup';
GO
;WITH DbData as (
SELECT name, 
 file_id as "File Id", 
 is_percent_growth,
 growth,
 physical_name as "Physical Name",
 CAST(CAST(ROUND(Size/128.,3) as DECIMAL(16,3)) as VARCHAR(16)) AS SizeMB,
 CAST(CAST(ROUND(FILEPROPERTY(name, 'SpaceUsed')/128.,3) as DECIMAL(16,3)) as VARCHAR(16)) AS UsedSpaceMB
FROM sys.database_files with (nolock) 
)
SELECT name AS [File Name], [File Id],
 RIGHT(SPACE(16) + CASE WHEN Len(SizeMB) > 7 
  THEN CASE WHEN Len(SizeMB) > 10 
  THEN LEFT(SizeMB, LEN(SizeMB) - 10) + ',' + SUBSTRING(SizeMB, LEN(SizeMB) - 10, 3) + ',' + RIGHT(SizeMB, 7)
  ELSE LEFT(SizeMB, LEN(SizeMB) - 7) + ',' + RIGHT(SizeMB, 7) END ELSE SizeMB END, 16) as SizeMB,
 RIGHT(SPACE(16) + CASE WHEN Len(UsedSpaceMB) > 7 
  THEN CASE WHEN Len(UsedSpaceMB) > 10 
  THEN LEFT(UsedSpaceMB, LEN(UsedSpaceMB) - 10) + ',' + SUBSTRING(UsedSpaceMB, LEN(UsedSpaceMB) - 10, 3) + ',' + RIGHT(UsedSpaceMB, 7)
  ELSE LEFT(UsedSpaceMB, LEN(UsedSpaceMB) - 7) + ',' + RIGHT(UsedSpaceMB, 7) END ELSE UsedSpaceMB END, 16) as UsedSpaceMB,
 CASE is_percent_growth WHEN 0 THEN CAST(growth/128 as VARCHAR) + ' Mb'
    ELSE CAST(growth as VARCHAR) + ' %' END as AutoGrowth
FROM DbData
OPTION (RECOMPILE);
GO  
EXEC sp_executesql N'DBCC LOGINFO() WITH NO_INFOMSGS'; 
GO
That script produces following result sets:
1. Verify that Database in Full Recovery Model;
2. Provide File size and Used space size for Data and Log files;
3. Gives current list of VLFs from the Log file.
Here is what I have:

Script #3. Generating some data and transaction activity:
SELECT TOP 1000 REPLICATE('A',8000) AS Column_1
INTO tbl_Test_01 FROM sys.messages;
GO
Run Script #2 to see how files have been change:
As you can see Used Space have increased in both files; Log file has been grown and number of VLFs have been increased.

Script #4. First test: Will try to decrease Used Space in Transaction Log by doing Differential Database Backup:
BACKUP DATABASE [TestLogBackup] TO DISK = N'C:\SS2014\Backup\TestLogBackup_2_Diff.bak' 
WITH  DIFFERENTIAL, NOFORMAT, INIT, SKIP, NOUNLOAD, STATS = 10;
GO
By running Script #2 you can verify that Used Space in Transaction Log not even shrunk, but even increased a little bit:

Script #5. Second test: Will try to decrease Used Space in Transaction Log by doing Full Database Backup:
BACKUP DATABASE [TestLogBackup] TO  DISK = N'C:\SS2014\Backup\TestLogBackup_3_Full.bak' 
WITH NOFORMAT, INIT, SKIP, NOUNLOAD,  STATS = 10;
GO
Run Script #2 again and verify that this does not help:

Script #6. Third test: Will try to decrease Used Space in Transaction Log by doing Transaction Log Backup:
BACKUP LOG [TestLogBackup] 
TO DISK = N'C:\SS2014\Backup\TestLogBackup_4_Log.bak' 
WITH NOFORMAT, INIT, SKIP, STATS = 10;
GO

That Worked!!! Used Space in Transaction Log has shrunk:

So,if you did not know before, now you know: The first line of defense against growing Log file is having Model database in Simple Recovery Model.
The second line of defense is implementation of well planned RESTORE strategy with regular Transaction Log backups.


Thursday, March 24, 2016

DBCC CHECKDB vs Evil

DBCC CHECKDB is very resource intensive and long operation, but it is extremely important to perform against your databases.
Kendra Little has a wonderful blog about that topic: DBCC CheckDB: Frequently Asked Questions.

In my post I won't talk about "Importance", "Necessity" and "Resume changing events" associated with DBCC CHECKDB. I do not want to talk about job security at all, I want to talk about professional etiquette.

The DBA in an organization is the last line of defense for the company's data. Only you can protect it from loss and corruption. And I hope along with making regular verified backups you are doing regular DBCC CHECKDB against all of your databases.

So, will draw the line: that operation is important and DBA must do that.
Now, the question is, how to make it less painful.

Option 1.

Run DBCC CHECKDB against secondary server. That can be a mirror, secondary AlwaysOn server or any other working copy of your environment. That is pretty easy to set and produces good consistent results. You always can switch replicas and do the checkup against the primary one.
Cons: You must pay additional licensing. If your primary server has 64 Cores, you have to pay for additional 64 SQL Server core licenses on the secondary, where you perform DBCC CHECKDB. So, it is extremely expensive option.

Option 2.

Run DBCC CHECKDB against restored copy of the database. That is much cheaper option. You are using one, not very expensive server, not only to verify data integrity for multiple databases from several production servers, but in parallel with that you also verify quality of your backups.
That is wonderful option, but requires dedicated server and advanced procedure with a lot of moving parts.

Option 3.

Use DBCC CHECKFILEGROUP. That is almost the same as to use DBCC CHECKDB, but you can perform it against only one file group at the time. That means if you have huge partitioned database with "Sliding Window" partitioning structure, you need to run DBCC CHECKFILEGROUP only against your Primary group and the most recent/active group. There is no necessity to run it against old and well backed up data, which you can restore at any time in the case of corruption.
If you do not use "Sliding Window", you have an option to redistribute your checkup operation over time and do only one partition at a time to reduce overall pressure on the system.
In order to use that option, you have to have a partitioning in your huge database.

Option 4.

Split DBCC CHECKDB execution over its constituencies.
If you take a look at DBCC CHECKDB command description in MSDN you can find that this command contains three major parts: DBCC CHECKALLOC, DBCC CHECKCATALOG and DBCC CHECKTABLE. To reduce the pressure on your system you can run these portions separately. Even more, you can run DBCC CHECKTABLE against every table and even every index on your server.
Looks like the great idea: you simply load a service table with requests and service broker executes those DBCC checkups at any idle time of your server.
That approach looks so good that I decided to test it.

Option 4. Testing.

Test #1. I've created a script to collect all tables and indexes on a server. That script collected the data and in parallel run DBCC CHECKALLOC and DBCC CHECKCATALOG against each database on the server. As the second step it looped against the list of indexes and run DBCC CHECKTABLE against each of them.
Test #2. I've created another script just to loop over list of databases and run DBCC CHECKDB against each of them.

Option 4. Testing Results.

On my workstation Test #1 finished in 37 minutes and 23 seconds. Test #2 finished in just 7 minutes and 7 seconds.
The five times difference makes no sense of split DBCC CHECKDB on its constituencies. Even worse,
besides of doing DBCC CHECKALLOC, DBCC CHECKCATALOG and DBCC CHECKTABLE, it also validates the Service Broker data in the database and link-level consistency between table metadata and file system directories and files the filestream.

As the result of my research I can conclude that Option 4 is not really an option anymore.

Option 4.

*During the preparation of this post I also used materials from Paul Randal's blog post "Importance of how you run consistency checks"

Tuesday, March 22, 2016

Installing Polybase for SQL Server 2016 RC1

I've mention in my prior post about the problem of installation of Polybase: http://slavasql.blogspot.com/2015/11/sql-server-2016-ctp-installation.html

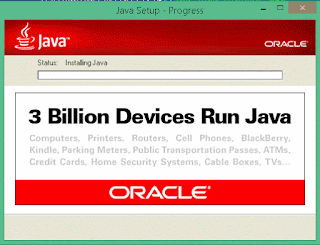
Now I decided to go to Oracle web site and download Java Driver.

After upgrading My SQL Server 2016 up to RC1 I went to "Add features to an existing installation" section and checked "PolyBase Query Service":

As expected, I've got the same error as with Community Review version:

Then I went to Oracle Java driver download page: http://www.oracle.com/technetwork/java/javase/downloads/jre7-downloads-1880261.html

I've reviewed Oracle License Agreement  (very recommend do the same before the download).

Then I've loaded two 64bit driver versions for Windows: jre-7u80-windows-x64.exe and jre-7u80-windows-x64.tar.gz.

If you are too picky (as me) and hate going to Oracle's web site you can download these files from my repository, but warn you, I can't guarantee that some hackers will replace them by infected copies:
Just in case will provide file sizes:
jre-7u80-windows-x64.exe - 31,239,592 bytes.
jre-7u80-windows-x64.tar.gz - 43,796,480 bytes.

Then I've started the installation:

Changed the driver installation folder:


And started installation:


After Installation was done,

I went back to SQL Server installation and clicked "Re-Run" checkup for "Feature Rules".
New screan immediately poped-up:

I clicked Next, and on the next screen changed PolyBase Engine Services to "manual" startup:

And finally, everything was successfully installed:

Now have to find the time to research and test the new feature.

Monday, March 21, 2016

SQL Server CPU utilization in Graphical form

Finally I can present something useful I've made with the help of my Spatial Data knowledge.
I will use Spatial Data to represent SQL Server CPU utilization.

How many times you connected to a SQL Server instance with complains to its performance?

What would you do the first?
I know that some people, instead of connecting to the instance open Remote Desktop Connection, which utilizes very important resources at the most critical time of the server, and simply run PerfMon.


I'd say it is not a bad idea, but it would be better to get these data remotely. Even better, if you look not at live counter, but load the file with counter's data, that would give you the historical perspective of your counters.
However, you must have these counters set. If you want to know how to do it, see my earlier post: "How to Automate collecting Perfmon Counters of Interest".

What if you did not know that and did not set your performance counters? Are you completely lost?

Not completely.
Benjamin Nevarez described in his blog on how to "Get CPU Utilization Data from SQL Server" and he inspired me to draw a diagram of the CPU utilization.

I've slightly changed his script and got the following:
DECLARE @gc VARCHAR(MAX), @gi VARCHAR(MAX);
WITH BR_Data as (
 SELECT timestamp, CONVERT(XML, record) as record
 FROM sys.dm_os_ring_buffers
 WHERE ring_buffer_type = N'RING_BUFFER_SCHEDULER_MONITOR' and record like '%<SystemHealth>%'
), Extracted_XML as (
 SELECT timestamp, record.value('(./Record/@id)[1]', 'int') as record_id,
  record.value('(./Record/SchedulerMonitorEvent/SystemHealth/SystemIdle)[1]', 'bigint') as SystemIdle,
  record.value('(./Record/SchedulerMonitorEvent/SystemHealth/ProcessUtilization)[1]', 'bigint') as SQLCPU
 FROM BR_Data
), CPU_Data as (
 SELECT record_id, ROW_NUMBER() OVER(ORDER BY record_id) as rn,
    dateadd(ms, -1 * ((SELECT ms_ticks  FROM sys.dm_os_sys_info) - [timestamp]), GETDATE()) as EventTime,
    SQLCPU, SystemIdle, 100 - SystemIdle - SQLCPU as OtherCPU
 FROM Extracted_XML )
SELECT @gc = CAST((SELECT  CAST(d1.rn as VARCHAR) + ' ' + CAST(d1.SQLCPU as VARCHAR) + ',' FROM CPU_Data as d1 ORDER BY d1.rn FOR XML PATH('')) as VARCHAR(MAX)),
@gi = CAST((SELECT  CAST(d1.rn as VARCHAR) + ' ' + CAST(d1.OtherCPU as VARCHAR) + ',' FROM CPU_Data as d1 ORDER BY d1.rn FOR XML PATH('')) as VARCHAR(MAX))
OPTION (RECOMPILE);

SELECT CAST('LINESTRING(' + LEFT(@gc,LEN(@gc)-1) + ')' as GEOMETRY), 'SQL CPU %' as Measure
UNION ALL
SELECT CAST('LINESTRING(1 100,2 100)' as GEOMETRY), ''
UNION ALL
SELECT CAST('LINESTRING(' + LEFT(@gi,LEN(@gi)-1) + ')' as GEOMETRY), 'Other CPU %'; 
 
I've got following as a result:
 
 
Then I've selected the second tab and got my SQL Server CPU utilization diagram:

That diagram provides you about 260 last minutes of Server CPU usage and measured in percents.

As you can see my SQL Server is mostly doing nothing and only during that blog-post writing in the last half and hour or so it is heavily running test scripts to over-utilize my CPU, but it still barely goes more than 60% of CPU (Blue line).

The Red line represents all other processes besides of SQL Server and you can tell if anything else from outside is impacting your performance.

Hope you'll like it.

Wednesday, March 2, 2016

Five Facts about DBCC UPDATEUSAGE

DBCC UPDATEUSAGE is probably very rare one. When I was asked about it Google gave me not a lot of links and all links were not very descriptive. Most of those links simply mimic MSDN documentation: https://msdn.microsoft.com/en-us/library/ms188414.aspx

I've been asked about UPDATEUSAGE because it run for few hours on one of our servers and produced a lot of blocking. That question was: Do we really need that procedure at all?

In order to answer that question we have to really understand what that procedure is responsible for and what it is doing.

I've started my research by restoring "AdventureWorks" database and created following scrip to see how UPDATEUSAGEwill behave on the biggest table in that sample database:


USE AdventureWorks2014
GO
PRINT 'Make Fake statistics -------------------------------------------------------------'
UPDATE STATISTICS [Person].[Person] WITH ROWCOUNT = 1000000, PAGECOUNT = 2000000;
GO
SELECT p.rows, a.total_pages, a.used_pages, a.data_pages
FROM sys.indexes i
INNER JOIN sys.partitions AS p ON i.object_id = p.object_id and i.index_id = p.index_id
INNER JOIN sys.allocation_units AS a ON a.container_id = p.partition_id
WHERE i.name = 'PK_Person_BusinessEntityID' and a.type = 1;
GO
PRINT 'Estimate space usage --------------------------------------------------------------'
DBCC UPDATEUSAGE ('AdventureWorks2014','Person.Person','PK_Person_BusinessEntityID') WITH ESTIMATEONLY;
GO
PRINT 'Fix space usage -------------------------------------------------------------------'
DBCC UPDATEUSAGE ('AdventureWorks2014','Person.Person','PK_Person_BusinessEntityID');
GO
SELECT p.rows, a.total_pages, a.used_pages, a.data_pages
FROM sys.indexes i
INNER JOIN sys.partitions AS p ON i.object_id = p.object_id and i.index_id = p.index_id
INNER JOIN sys.allocation_units AS a ON a.container_id = p.partition_id
WHERE i.name = 'PK_Person_BusinessEntityID' and a.type = 1;
GO
As the first step I faked statistics, to make picture worse, then I've captured Index allocations.
Then I've used here undocumented option "WITH ESTIMATEONLY" just to check what it will be doing.
After that I've run UPDATEUSAGE to fix all problems and captured the Index allocation again
Here are my results:
As you can see, UPDATEUSAGE found three problems with that table, while was running in "ESTIMATEONLY" mode. When it run in "Fix" mode it also found and fixed only three problems. The number of rows was still left unfixed.

To fix Row Counting problem we have to run it with additional "COUNT_ROWS" option:


DBCC UPDATEUSAGE ('AdventureWorks2014','Person.Person','PK_Person_BusinessEntityID') WITH ESTIMATEONLY;
GO
DBCC UPDATEUSAGE ('AdventureWorks2014','Person.Person','PK_Person_BusinessEntityID') WITH COUNT_ROWS;
GO
SELECT p.rows, a.total_pages, a.used_pages, a.data_pages
FROM sys.indexes i
INNER JOIN sys.partitions AS p ON i.object_id = p.object_id and i.index_id = p.index_id
INNER JOIN sys.allocation_units AS a ON a.container_id = p.partition_id
WHERE i.name = 'PK_Person_BusinessEntityID' and a.type = 1;
GO
As the result I've got following:
As you can see, "ESTIMATEONLY" option did not find any problems and only the option "COUNT_ROWS" helped to identify and fix an error.

So, from that test we can learn following fact:

1. DBCC UPDATEUSAGE has to be used with "COUNT_ROWS" option to fix all possible problems.

My next test was to check locking. I


BEGIN TRAN

SELECT * FROM Person.Person WITH (ROWLOCK,XLOCK)
WHERE BusinessEntityID = 10
------------ Stop Script Here and run DBCC UPDATEUSAGE in another Tab
ROLLBACK
Obviously, that script produced Exclusive Lock on one particular row, which held UPDATEUSAGE procedure until I release the transaction by rolling it back.

That gave us another two facts:

2. DBCC UPDATEUSAGE does a full scan of an Index.

3. Because of #2, it is not worth to run that job twice without "COUNT_ROWS" option and with it.

After knowing what UPDATEUSAGE is doing we can try answer the question: Can we live without it or not?

For that we will run following script


PRINT 'Make Fake statistics -------------------------------------------------------------'
UPDATE STATISTICS [Person].[Person] WITH ROWCOUNT = 1000000, PAGECOUNT = 2000000;
GO
SELECT p.rows, a.total_pages, a.used_pages, a.data_pages
FROM sys.indexes i
INNER JOIN sys.partitions AS p ON i.object_id = p.object_id and i.index_id = p.index_id
INNER JOIN sys.allocation_units AS a ON a.container_id = p.partition_id
WHERE i.name = 'PK_Person_BusinessEntityID' and a.type = 1;
GO
PRINT 'Estimate space usage --------------------------------------------------------------'
DBCC UPDATEUSAGE ('AdventureWorks2014','Person.Person','PK_Person_BusinessEntityID') WITH ESTIMATEONLY;
GO
-- DBCC UPDATEUSAGE ('AdventureWorks2014','Person.Person','PK_Person_BusinessEntityID');
PRINT 'Trying to fix space usage -------------------------------------------------------------------'
UPDATE STATISTICS [Person].[Person] [PK_Person_BusinessEntityID] WITH FULLSCAN;
GO
SELECT p.rows, a.total_pages, a.used_pages, a.data_pages
FROM sys.indexes i
INNER JOIN sys.partitions AS p ON i.object_id = p.object_id and i.index_id = p.index_id
INNER JOIN sys.allocation_units AS a ON a.container_id = p.partition_id
WHERE i.name = 'PK_Person_BusinessEntityID' and a.type = 1;
GO
PRINT 'Estimate space usage again --------------------------------------------------------------'
DBCC UPDATEUSAGE ('AdventureWorks2014','Person.Person','PK_Person_BusinessEntityID') WITH ESTIMATEONLY;
GO

In that scrip I've tried to fix existing problems by simple Statistics' Update.
As you can see from the screenshot, it did not help at all.

The next try with Index Reorganize:


PRINT 'Make Fake statistics -------------------------------------------------------------'
UPDATE STATISTICS [Person].[Person] WITH ROWCOUNT = 1000000, PAGECOUNT = 2000000;
GO
SELECT p.rows, a.total_pages, a.used_pages, a.data_pages
FROM sys.indexes i
INNER JOIN sys.partitions AS p ON i.object_id = p.object_id and i.index_id = p.index_id
INNER JOIN sys.allocation_units AS a ON a.container_id = p.partition_id
WHERE i.name = 'PK_Person_BusinessEntityID' and a.type = 1;
GO
PRINT 'Estimate space usage --------------------------------------------------------------'
DBCC UPDATEUSAGE ('AdventureWorks2014','Person.Person','PK_Person_BusinessEntityID') WITH ESTIMATEONLY;
GO
-- DBCC UPDATEUSAGE ('AdventureWorks2014','Person.Person','PK_Person_BusinessEntityID');
PRINT 'Trying to fix space usage -------------------------------------------------------------------'
ALTER INDEX [PK_Person_BusinessEntityID] ON [Person].[Person] REORGANIZE;
GO
SELECT p.rows, a.total_pages, a.used_pages, a.data_pages
FROM sys.indexes i
INNER JOIN sys.partitions AS p ON i.object_id = p.object_id and i.index_id = p.index_id
INNER JOIN sys.allocation_units AS a ON a.container_id = p.partition_id
WHERE i.name = 'PK_Person_BusinessEntityID' and a.type = 1;
GO
PRINT 'Estimate space usage again --------------------------------------------------------------'
DBCC UPDATEUSAGE ('AdventureWorks2014','Person.Person','PK_Person_BusinessEntityID') WITH ESTIMATEONLY;
GO
And it also had no results.

As the last resort I've tried Index Rebuild:


PRINT 'Make Fake statistics -------------------------------------------------------------'
UPDATE STATISTICS [Person].[Person] WITH ROWCOUNT = 1000000, PAGECOUNT = 2000000;
GO
SELECT p.rows, a.total_pages, a.used_pages, a.data_pages
FROM sys.indexes i
INNER JOIN sys.partitions AS p ON i.object_id = p.object_id and i.index_id = p.index_id
INNER JOIN sys.allocation_units AS a ON a.container_id = p.partition_id
WHERE i.name = 'PK_Person_BusinessEntityID' and a.type = 1;
GO
PRINT 'Estimate space usage --------------------------------------------------------------'
DBCC UPDATEUSAGE ('AdventureWorks2014','Person.Person','PK_Person_BusinessEntityID') WITH ESTIMATEONLY;
GO
-- DBCC UPDATEUSAGE ('AdventureWorks2014','Person.Person','PK_Person_BusinessEntityID');
PRINT 'Trying to fix space usage -------------------------------------------------------------------'
ALTER INDEX [PK_Person_BusinessEntityID] ON [Person].[Person] REBUILD;
GO
SELECT p.rows, a.total_pages, a.used_pages, a.data_pages
FROM sys.indexes i
INNER JOIN sys.partitions AS p ON i.object_id = p.object_id and i.index_id = p.index_id
INNER JOIN sys.allocation_units AS a ON a.container_id = p.partition_id
WHERE i.name = 'PK_Person_BusinessEntityID' and a.type = 1;
GO
PRINT 'Estimate space usage again --------------------------------------------------------------'
DBCC UPDATEUSAGE ('AdventureWorks2014','Person.Person','PK_Person_BusinessEntityID') WITH ESTIMATEONLY;
GO
As you can see, Index Rebuild almost did the trick! It fixed our faked counts for pages and records.


Rebuild did not fix overestimated numbers of used and total pages. That is actually strange, because it had all information for it.

From this test we've learn one more fact:

4. If amount of Space, used by your data is not critical and you are running Index Rebuild on the regular basis, you do not really have to run DBCC UPDATEUSAGE.

As the last check, I've looked at any error messages suggesting to run UPDATEUSAGE and I've found two of them:
Error 2508: The %.*ls count for object "%.*ls", index ID %d, partition ID %I64d, alloc unit ID %I64d (type %.*ls) is incorrect. Run DBCC UPDATEUSAGE.
 

Error 20558: Table '%s' passed full rowcount validation after failing the fast check. DBCC UPDATEUSAGE will be initiated automatically.

I've never had these kind of messages, but I'm pretty sure they are supposed to be produced by DBCC CHECKDB or one of its components.

That is the last piece of information:

5. You have to run "DBCC UPDATEUSAGE" when you have an error associated with it.

If anybody have interesting experience with UPDATEUSAGE procedure, please post it here for everybody's advantage.